ValueError: The number of FixedLocator locations (9), usually from a call to set_ticks, does not match the number of ticklabels (8).
运行书中例题时发现了这个错误,
原代码如上:
import numpy as np
import matplotlib.pyplot as plt
import matplotlib

matplotlib.rcParams[\'font.family\']=\'simhei\'
# 某学生的课程与成绩
courses = np.array([\'C++\',\'Python\',\'高数\',\'大学英语\',\'软件工程\',
           \'组成原理\',\'数字图像处理\',\'计算机图形学\'])
scores=np.array([80,95,78,85,45,65,80,60])

datalength = len(scores)     #数据长度

# angles数组把圆周等分为dataLength份
angles = np.linspace(0,         #数组第一个数据
                    2*np.pi,    #数组最后一个暑假
                    datalength, #数组中的数据量
                    endpoint=False) #不包含终点

scores = np.concatenate((scores,[scores[0]]))
angles = np.concatenate((angles,[angles[0]]))

# 绘制雷达图
print(angles)
print(\'=\'*20)
print(scores)
plt.polar(angles,
          scores,
          \'rv--\',
          linewidth=2)
# 设置角度网络标签
plt.thetagrids(angles*180/np.pi,courses)
# 填充雷达图内部
plt.fill(angles,scores,facecolor=\'r\',alpha=0.6)

plt.show()

自己搜查资料后,了解到,只对socres,和angles做闭合还是不够
需要再对courses进行闭合
courses = np.concatenate((courses,[courses[0]]))
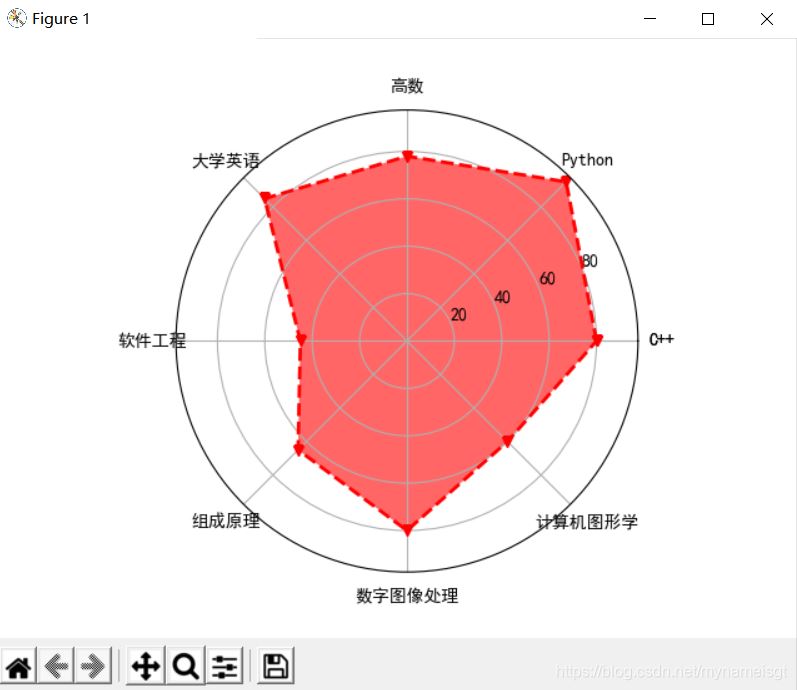
此时就能正确运行出来。
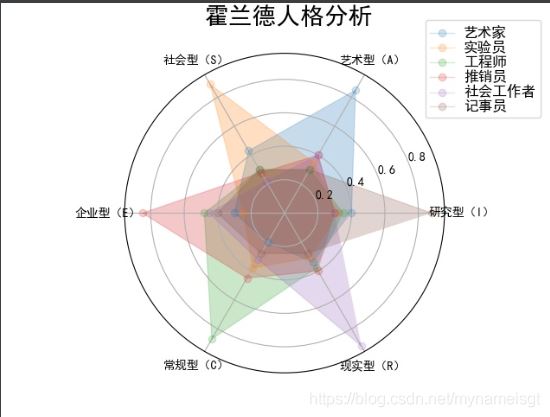
这里在附上霍兰德人格分析代码:
import numpy as np
import matplotlib.pyplot as plt
import matplotlib

matplotlib.rcParams[\'font.family\']=\"SimHei\"
radar_labels = np.array([\'研究型(I)\',\'艺术型(A)\',\'社会型(S)\',\\
                        \'企业型(E)\',\'常规型(C)\',\'现实型(R)\'])
data = np.array([[0.40, 0.32, 0.35, 0.30, 0.30, 0.88],
                 [0.85, 0.35, 0.30, 0.40, 0.40, 0.30],
                 [0.43, 0.89, 0.30, 0.28, 0.22, 0.30],
                 [0.30, 0.25, 0.48, 0.85, 0.45, 0.40],
                 [0.20, 0.38, 0.87, 0.45, 0.32, 0.28],
                 [0.34, 0.31, 0.38, 0.40, 0.92, 0.28]])
data_labels =(\'艺术家\',\'实验员\',\'工程师\',\'推销员\',\'社会工作者\',\'记事员\')


angles = np.linspace(0, 2*np.pi, 6, endpoint=False)
fig = plt.figure(facecolor = \"white\")
plt.subplot(111, polar = True)
plt.plot(angles, data,\'o-\',linewidth=1, alpha=0.2)
plt.fill(angles, data, alpha=0.25)
plt.thetagrids(angles*180/np.pi, radar_labels)
plt.figtext(0.52, 0.95, \'霍兰德人格分析\', ha=\'center\', size=20)
legend = plt.legend(data_labels, loc = (0.94, 0.80), labelspacing = 0.1)
plt.setp(legend.get_texts(), fontsize=\'large\')
plt.grid(True)
plt.savefig(\'holland_radar.jpg\')
plt.show()
到此这篇关于Python绘制雷达图时遇到的坑的解决的文章就介绍到这了,更多相关Python绘制雷达图内容请搜索自学编程网以前的文章或继续浏览下面的相关文章希望大家以后多多支持自学编程网!